Before you start the exercises, look through an introduction to interpreting seismic data (1.3 MB pdf)
Normal or Reverse?
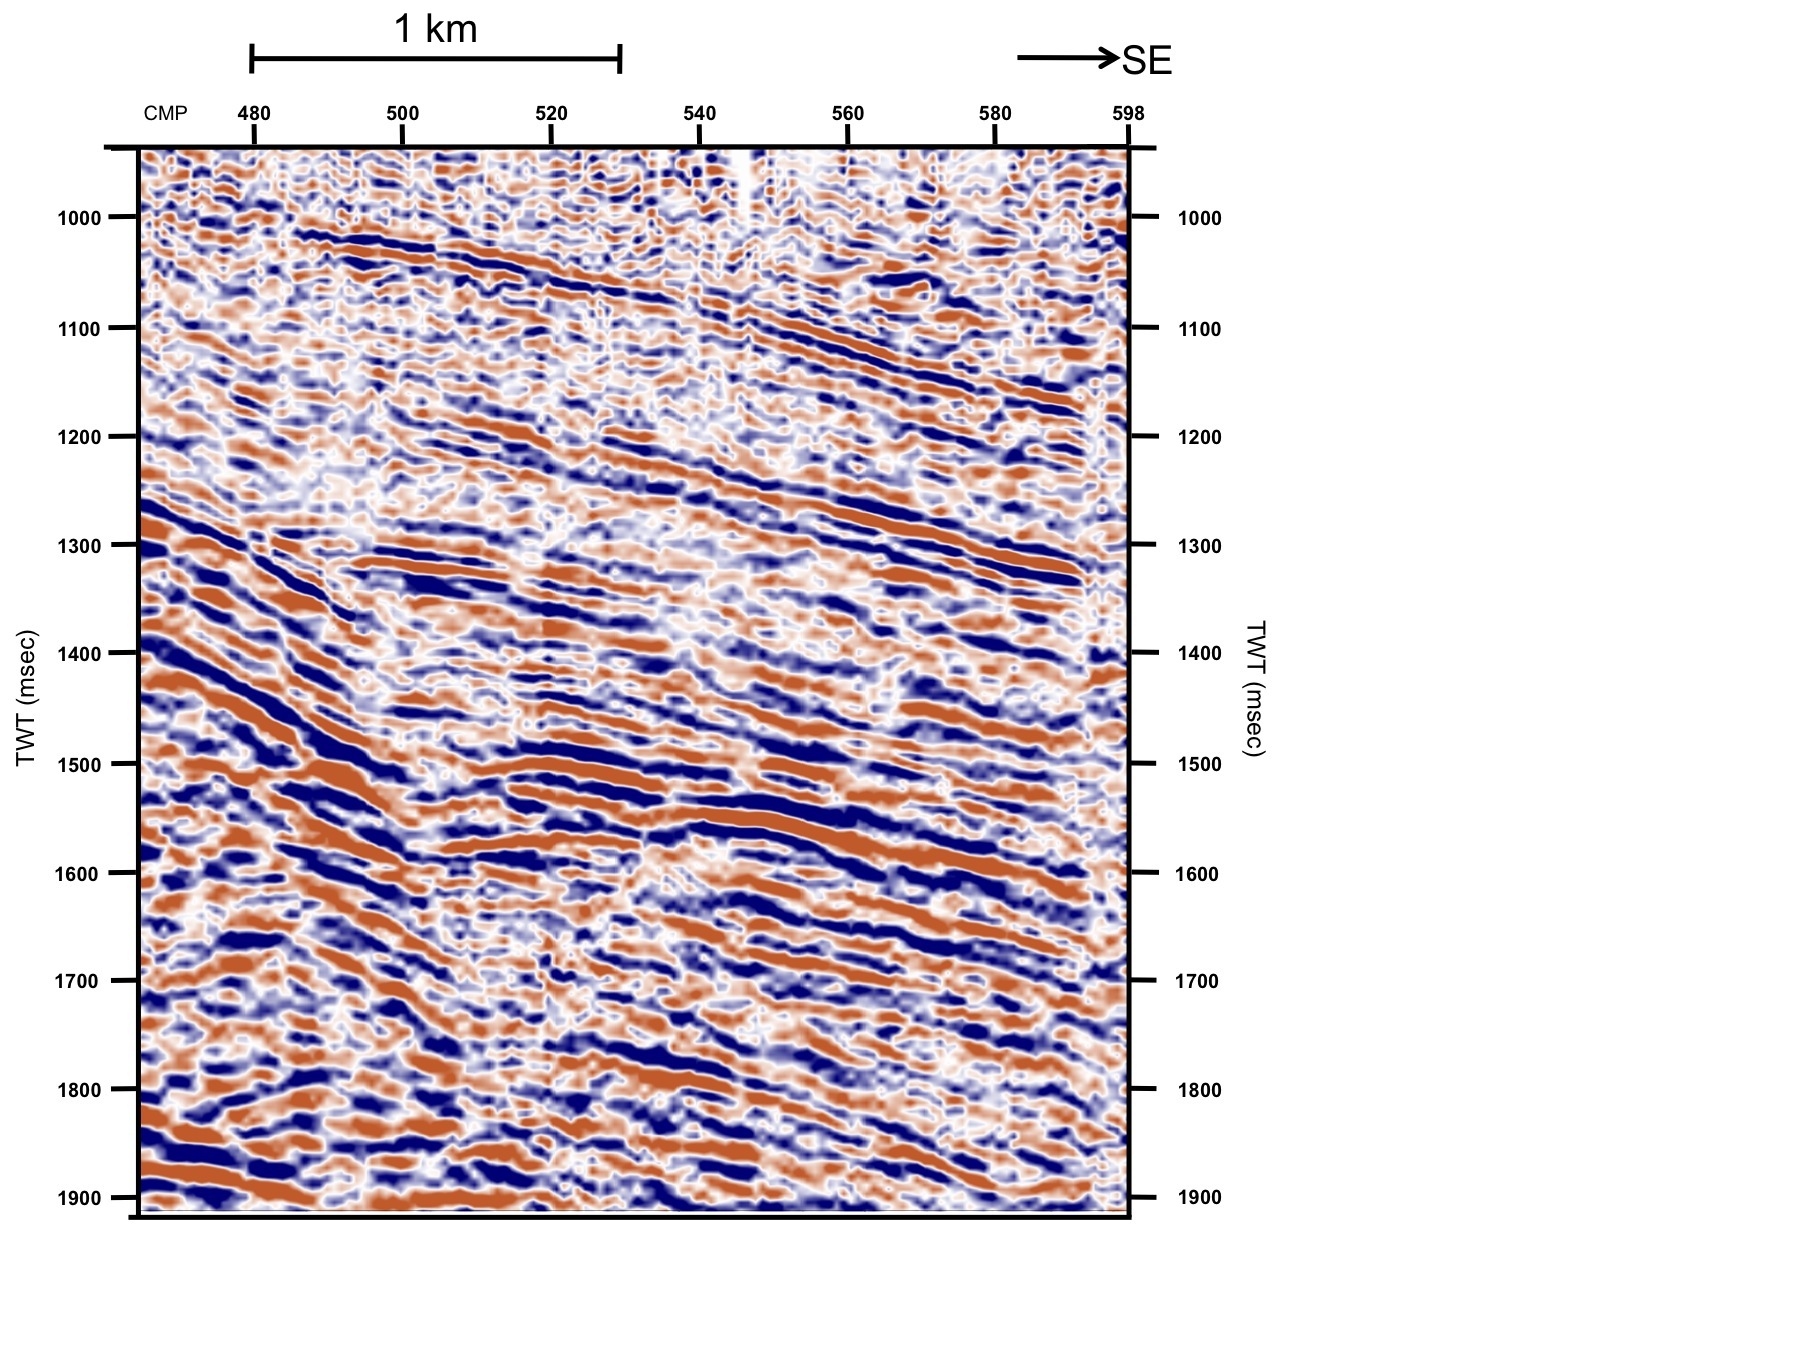
Watch this presentation (1869 KB ppt), print out the seismic image:  and have a go at the interpretation.
Click here for a possible interpretation and see how yours compares!
Fault Picking
This section contains an exercise to practice the techniques learned in ‘Normal or Reverse’?
There are two versions of the exercise, in version 1 you have to interpret the data first and then pick the faults, in version 2 some interpretation has already been done for you. There is also a PowerPoint document containing the suggested answer.
- Version 1: Student worksheet (2984 KB doc)
- Version 1: Seismic image (458 KB jpg)
- Version 2: Student worksheet (7656 KB doc)
- Version 2: Seismic image (470 KB jpg)
- Suggested answer (930 KB ppt)
3D Fault Model: a cut out and keep model with a mapping exercise
It can be difficult to visualize faults in three dimensions and so this section contains a 3D model to help you. Print it out and assemble it to show you the relationship between the seismic data and the fault plane.
The model can then be used in a mapping exercise where you use the model to decide where to site a new dam for a reservoir. Answers and extension activities to the exercise are available in this PowerPoint document (1495 KB ppt).
Building the model
Important note: the fault model and map are all at the same scale, ensure that you do not resize them when printing.
Open and print: Instruction document (7.8 MB doc)
Open and print: Mapping exercise (148 KB doc)
You may want to print a large version of the 3D model for demonstration purposes but please be aware that the map does not fit these A4 sized images. Again do not re-size or the separate parts will not fit together.
Geological History: sequencing geological events
This exercise gives the opportunity to use some of the laws of geology to put the structures seen on the seismic into the correct order.
There are two versions of the exercise, in version 1 you have to interpret horizons and structures on the data first and then put the events in the correct order, in version 2 the interpretation has already been done for you. There is also a PowerPoint presentation containing the suggested answer and some extension activities.


